Loading...
Searching...
No Matches
◆ extract_onset_data()
| std::vector< std::vector< double > > MayaFlux::Yantra::extract_onset_data | ( | const std::vector< std::span< const double > > & | data, |
| double | threshold = 0.3, |
||
| uint32_t | region_size = 512, |
||
| uint32_t | window_size = 1024, |
||
| uint32_t | hop_size = 256 |
||
| ) |
Extract data at onset/transient positions using spectral flux.
- Parameters
-
data Input data span threshold Onset detection threshold (normalized 0-1) region_size Size of region around each onset to extract window_size FFT window size for spectral analysis hop_size Hop size for spectral analysis
- Returns
- Vector containing actual data from onset regions
Definition at line 618 of file ExtractionHelper.cpp.
624{
625 std::vector<std::vector<double>> result;
626 result.reserve(data.size());
627
628 for (const auto& channel : data) {
629 if (channel.empty()) {
630 result.emplace_back();
631 continue;
632 }
633
634 try {
635 std::vector<size_t> onset_positions = find_onset_positions(
636 channel, window_size, hop_size, threshold);
637
638 if (onset_positions.empty()) {
639 result.emplace_back();
640 continue;
641 }
642
643 std::vector<double> extracted_data;
644 for (size_t onset_pos : onset_positions) {
645 const size_t half_region = region_size / 2;
646 const size_t region_start = (onset_pos >= half_region) ? onset_pos - half_region : 0;
647 const size_t region_end = std::min(onset_pos + half_region, channel.size());
648
649 if (region_start < region_end) {
650 auto region = channel.subspan(region_start, region_end - region_start);
651 std::ranges::copy(region, std::back_inserter(extracted_data));
652 }
653 }
654
655 result.push_back(std::move(extracted_data));
656 } catch (const std::exception&) {
657 result.emplace_back();
658 }
659 }
660
661 return result;
662}
References find_onset_positions().
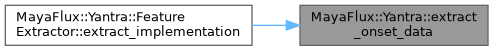
Referenced by MayaFlux::Yantra::FeatureExtractor< InputType, OutputType >::extract_implementation().
 Here is the call graph for this function:
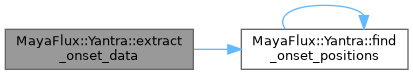 Here is the caller graph for this function: